
SP 500 (SPX) Analysis - how we do it
Our analysis methods enable us to accurately predict S&P 500 (SPX) turning points with our proprietary cycle analysis. We do not use traditional lagging technical indicators.
Cycleforecasts research approach is based on historical market data points and historical events that harmonic analysis research is then performed on to identify reversal dates.
Our methodology includes S&P 500 (SPX) and INDU data points that reveal repeating time periods these are combined with Natural cycles that are of specific values and are calculated using Natural time and also Astrological time interpretations. The Cycles vary in duration from days to over two thousand years and can be known by the repeating periods that reveal the cycle that will be effective. These cycles and calculation methods are what enables us to determine precise turning points before they occur.
Our forecasts require determining what cycles are currently operating in the immediate future for a period of 7 days in advance. Other historical factors are then analysed to verify if they conform to a particular cycle being active.
Typical of our S&P 500 cycles analysis is determining when historical cycles align with the SPX cycles.
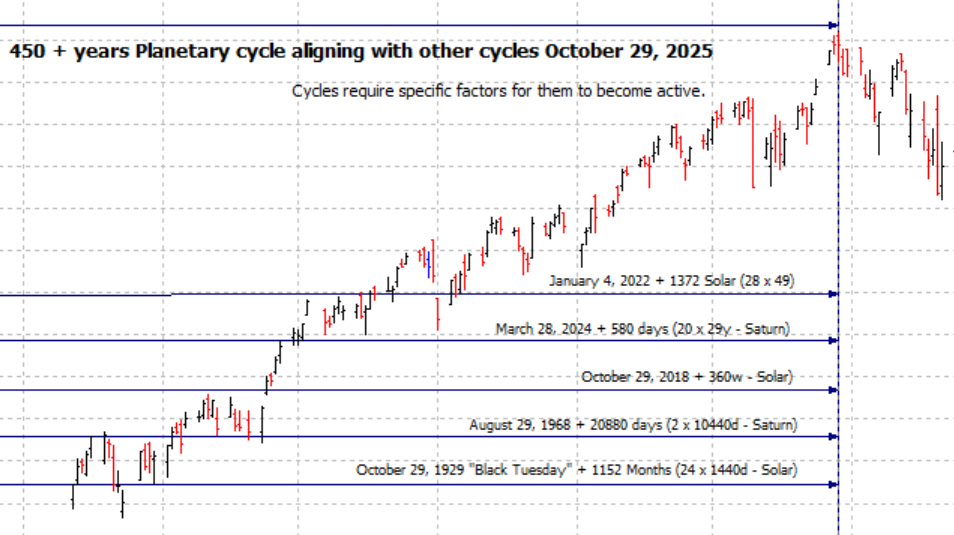
Although time cycles are the main factor in identifying when a potential reversal may occur, price cycles and other technical indicators should be reviewed to assess whether the time factor and the market price are aligning near important technical levels.
Quote by WD Gann
“I get the past history and find out what cycle we are in and then predict the curve for the future, which is a repetition of past market movements”