
SP 500 (SPX) 7 Day Forecasts
How to trade the S&P-500 using our precise forecasts.
Our forecasts are ideal for short term S&P 500 traders so as to execute early trade entries with close stops and then confidently hold trades until the next predicted turning point. Position traders wanting confirmation on expected trend changes will also benefit by having the confidence of confirmation of an anticipated trend change. It is important to determine price levels on the forecasted reversal date to obtain the maximum benefit.
What is the forecast for the S&P-500 today?
If a reversal is indicated for today you would use commonly used price support and resistance levels or price projection levels to determine where to make your trade execution.
What is the forecast for the S&P-500 tomorrow?
Our 7 day forecasts will tell you on which day in each 7 day period will reveal the factors present that cause a reversal. When you receive your weekly forecast prior to each Wednesday you will then know which days will be a turning point or a “hold” day before they occur.
What is the forecast for the S&P-500 this week?
Our methodology replaces emotional guesswork and other lagging indicators with objective data analysis that reveal the precise dates of turning points in each week, however it is important to note the following qualifications.
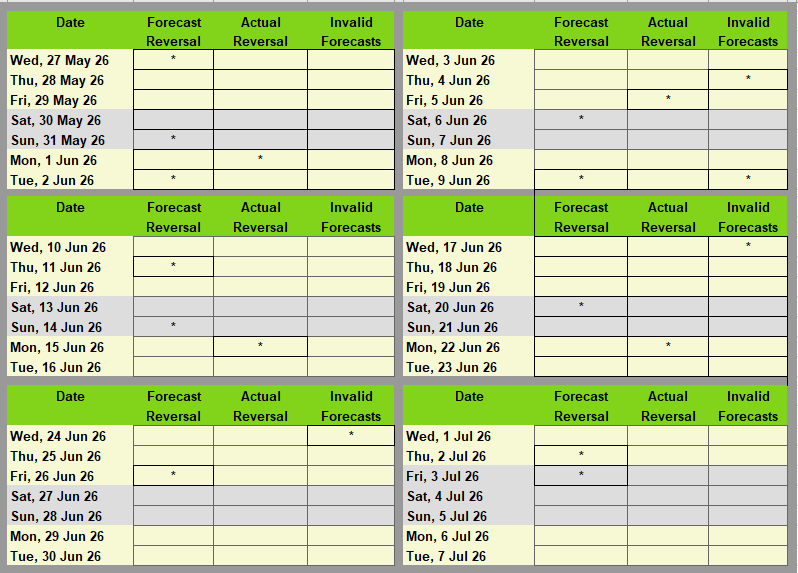
If a turning point is predicted for a Saturday or a Sunday the reversal will occur on the Friday before, or the Monday after.
If a reversal is predicted to occur on a Monday and it is a non trading day, the reversal can occur on the Friday before, or the Tuesday following.
This variance is due to the 4 day window of possible cycle reactions only having the Friday or Monday to occur on. The following sample forecasts show the non trading days and the forecast dates and actual reversal dates occurring before or after the non trading days.
Typical of our forecasts – for the 6 week period May 27, 2026 to July 7, 2026 that also shows under
“Invalid Forecasts” either missed or incorrect predicted dates.
Reversal Date Notes
A ‘reversal day” is the time where our cycle analysis indicates a day that has the factors present that indicate when a change of direction will occur.
Not every reversal day will produce the same type of reaction. Some days with the factors present for a reversal, that are indicated by our historically more recent analysis, may also align with a cycle that is of much greater magnitude that cannot be fully verified due to its great time expanse. Consequently, it is usually not able to be dependably forecast as a major reversal date.
The scale of the market reaction can also depend on where the S&P 500 (SPX) is trading within its broader wave structure, trend direction, and price cycle position at the time.
Where no reversal day is predicted it can usually be a “hold’ position until the next predicted reversal day. It is important to note that not all turning points may be accurately predicted, consequently prudent use of stop loss or other exit strategies should be employed.
Within our weekly forecasts examples as displayed above, “Invalid Forecast” refers to missed or incorrect turning points. This can be due to reliance on data points from the INDU prior to the 1957 establishment date of the SPX.
Cycleforecasts uses time cycle research to identify reversal dates in advance, while recognising that market conditions can vary and should always be assessed with proper risk management.
Disclaimer
Cycleforecasts provides technical market cycle research and timing analysis for educational and informational purposes only.
The service does not provide financial advice, investment advice, guaranteed market predictions, or direct buy or sell signals. Forecasts should always be interpreted alongside independent analysis and appropriate risk management.
Please review the full Risk Disclaimer before using the service.