S&P-500
Precise Reversal Day Forecasts
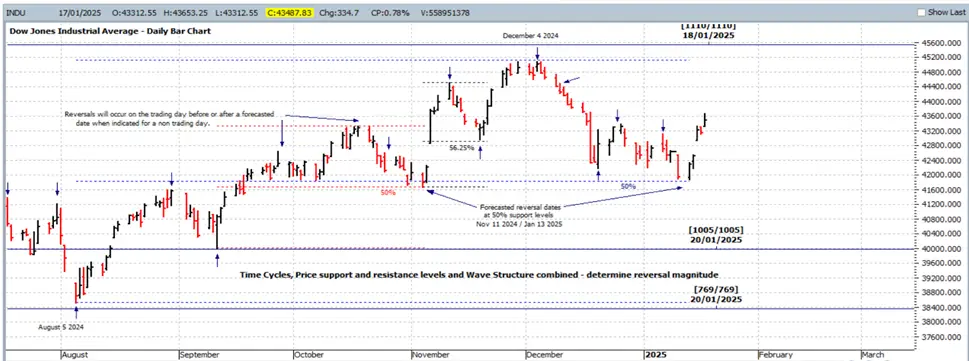
From analysis of over 100 years of market history precise reversal dates can be forecasted for the
S&P-500 (Index)
Cycles are present in all aspects of life however there are only specific cycles that cause sentiment changes at times of market reversals. Forecasting reversal dates requires knowledge of these specific cycles and an understanding of how cycles and time need to be calculated.
Sentiment influencing events that have affected major markets, such as unexpected news announcements, war and terrorism incidents and natural events used in conjunction with specific time analysis methods can enable points in time to be determined when markets can be expected to have reversals.
The presence of cycles at market reversals is commonly known. What is now available for subscribers to cycleforecasts.com is the opportunity to know in advance reversal dates for the S&P-500. Cycle reversal dates can be used in conjunction with other commonly used trading methods for more advanced trading executions or as a stand-alone method in any time frame.
Historical cycles affect all markets, however individual markets also contain their own unique cycles that cause their variations. Forecasts are currently only provided for the S&P-500.


A Time cycle is the major factor in determining a reversal. Knowing that cycle and its past history enables the precise date to be known for when that cycle will complete. The exact price of the reversal on this day will be when the Price cycle has also completed.
On most occasions where a market is trading at within its wave structure on the day of a Forecasted cycle date is what effects the type of reaction that will occur on that day. Only when the Time and Price cycles have aligned will a significant reversal occur, this will be at a price support or resistance level or a projection of a previous trading range.
On occasions some cycles will cause rapid and significant reversals before the main trend is resumed at the next cycle. Other cycles may only have a minor effect when acting against the main trend.
Time Cycles and Price Support and Resistance levels are where optimum trading is found.
When trading using Time cycles you should have knowledge and experience in identifying market structure and price levels. Our forecasts will indicate both minor and significant reversals including reversal dates that commence and complete trends ranging from days to years in duration.
Subscribers receive the exact dates of many of the reversals each month in advance for the S&P-500
In addition to monthly forecasted reversal dates updates may be provided during a subscription month at no additional cost if additional information becomes available.

